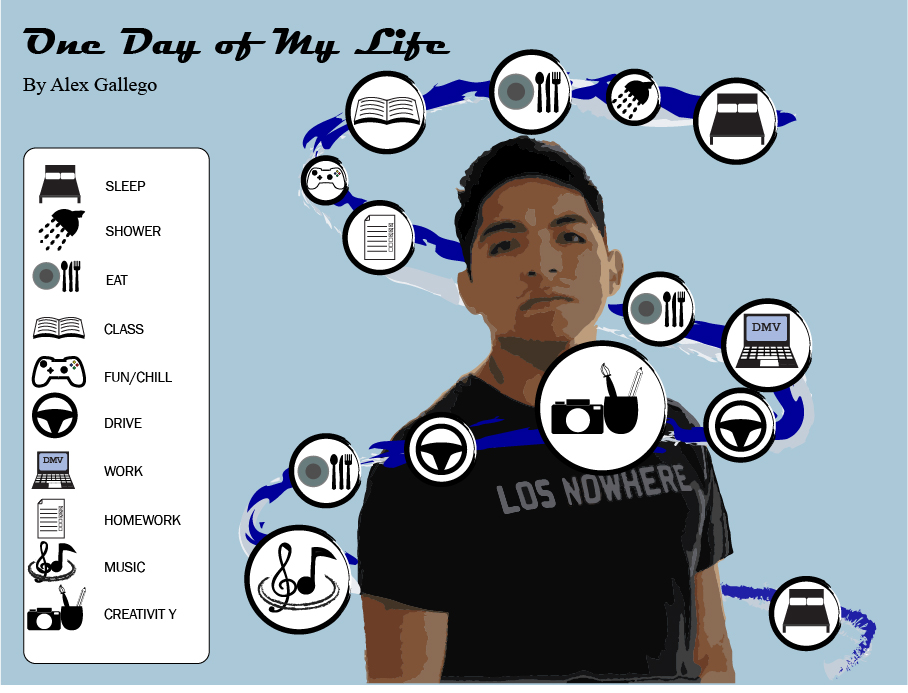
In this project I created an artwork that represents a normal week in my life. for this I compiled some photos and videos of important things of my week. In this project I highlighted things like my job, college, free time, creativity, and some other things.
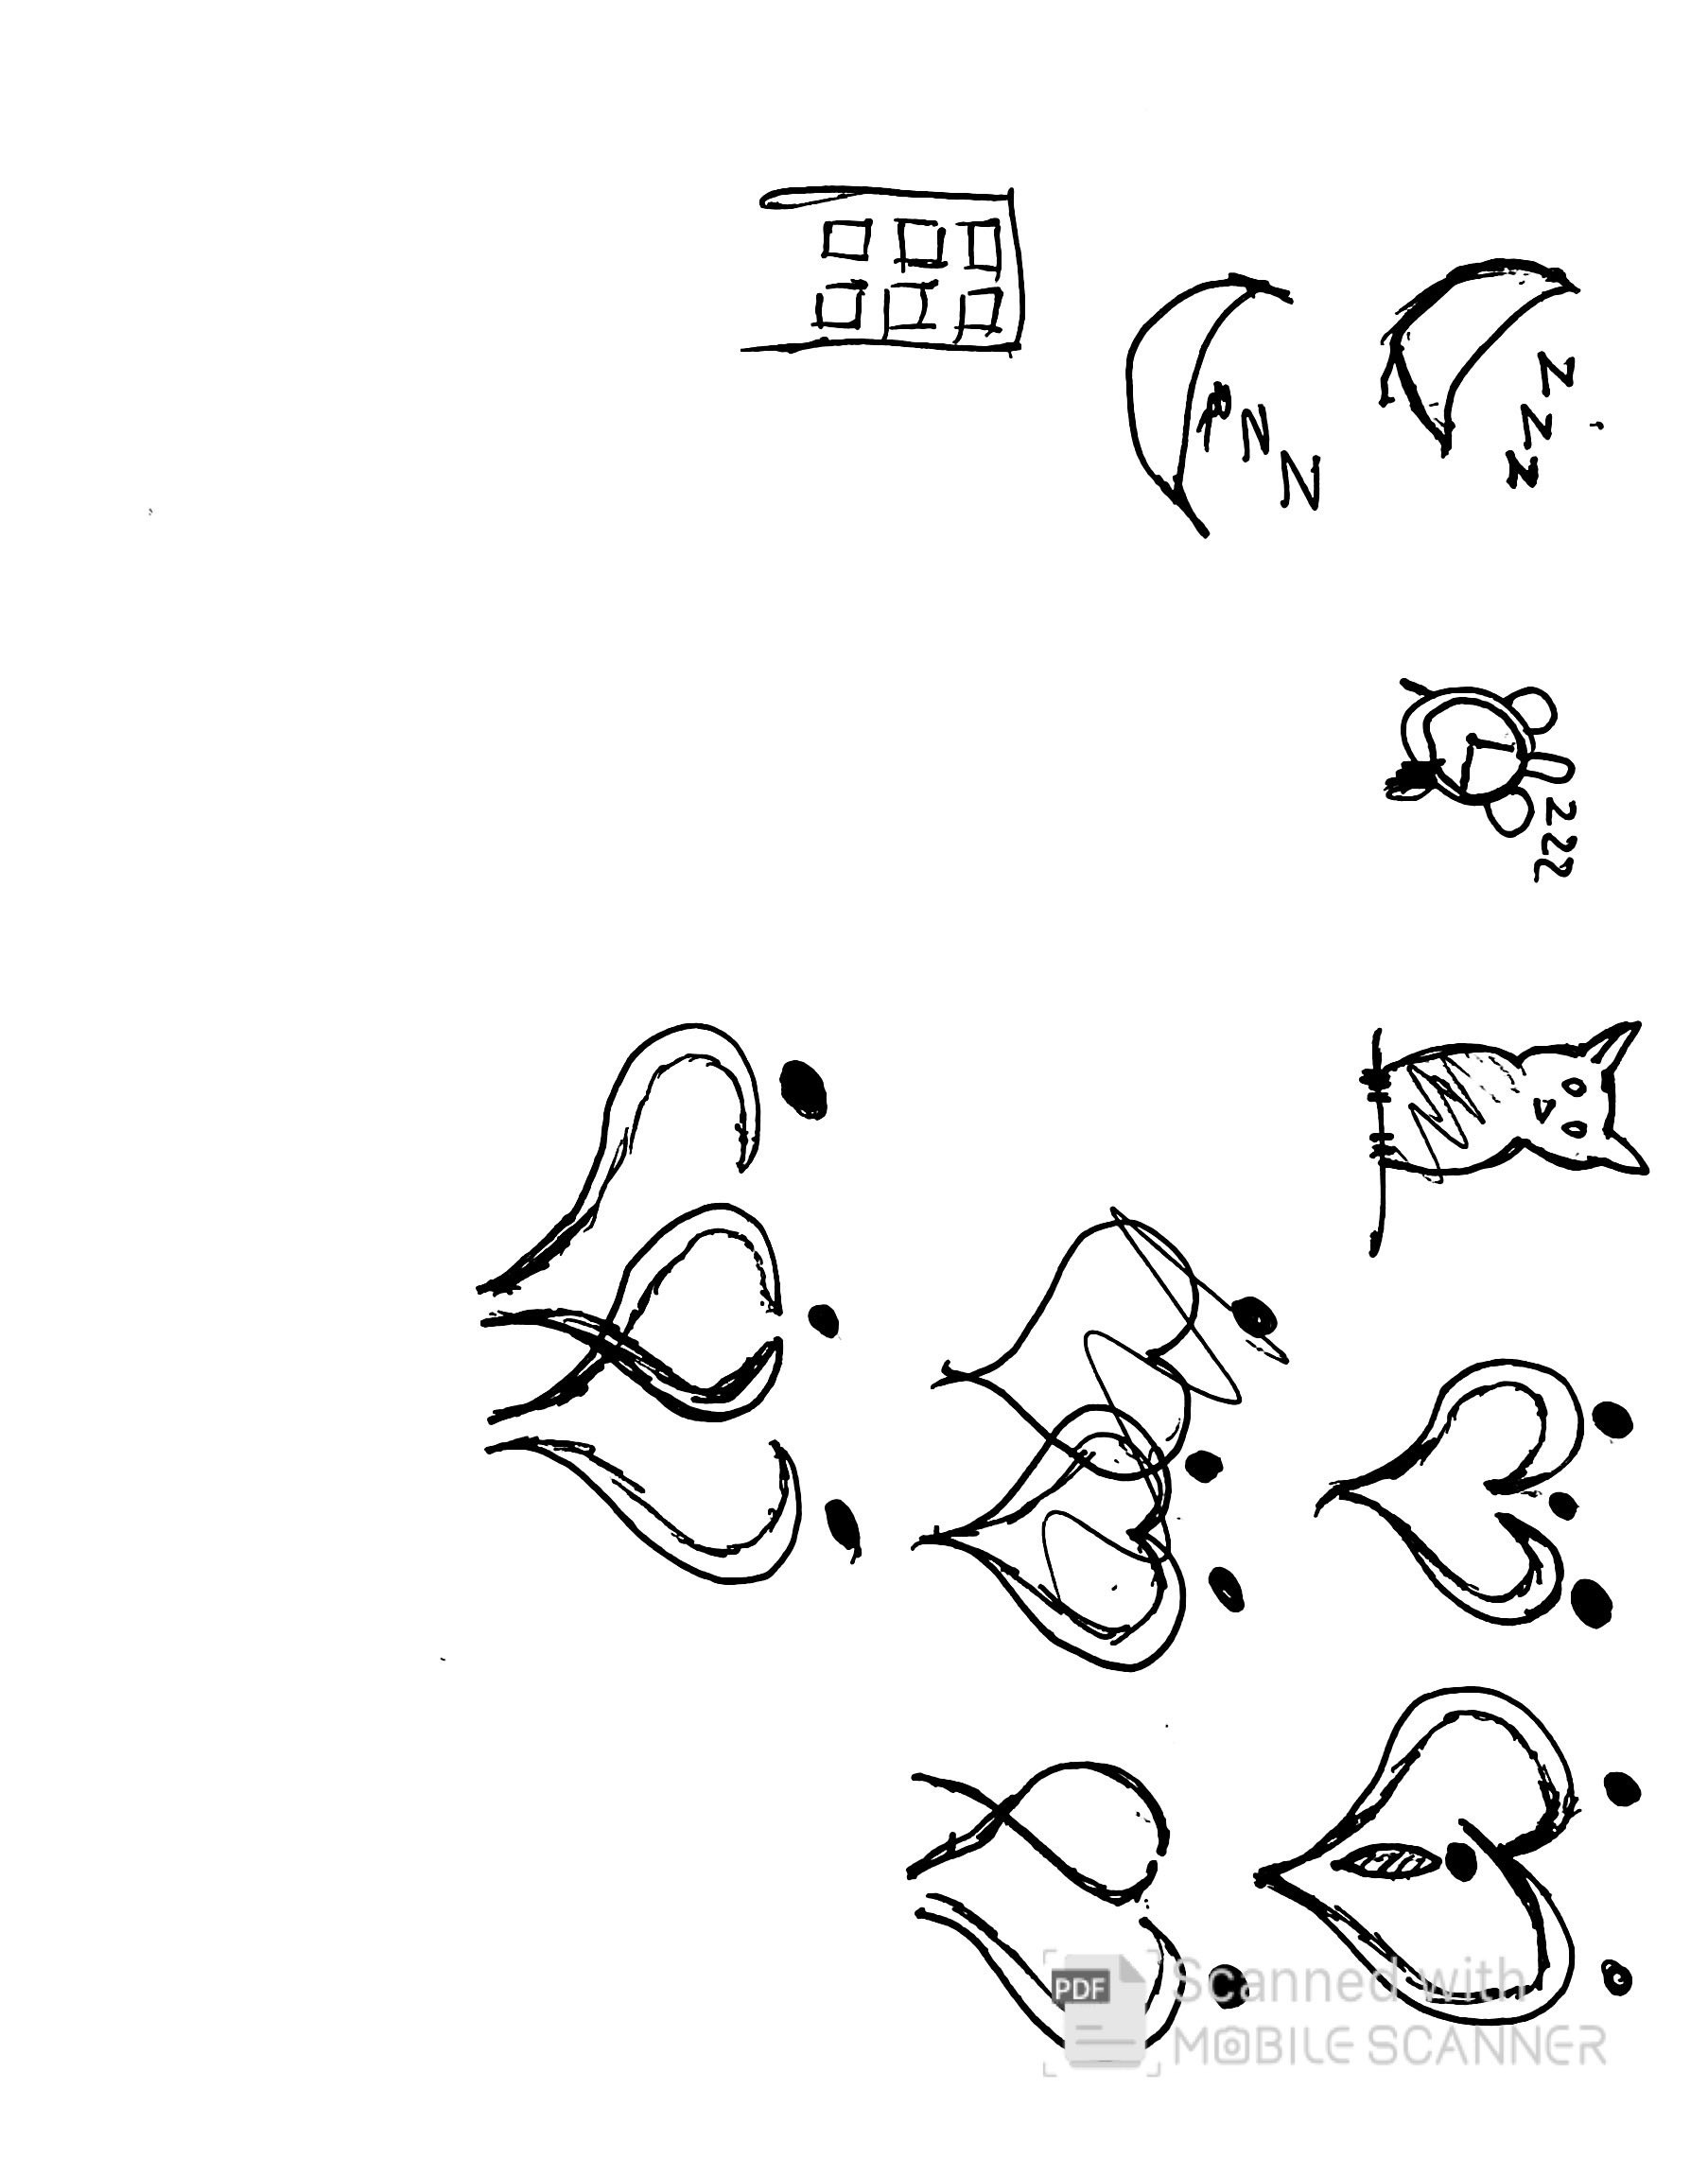
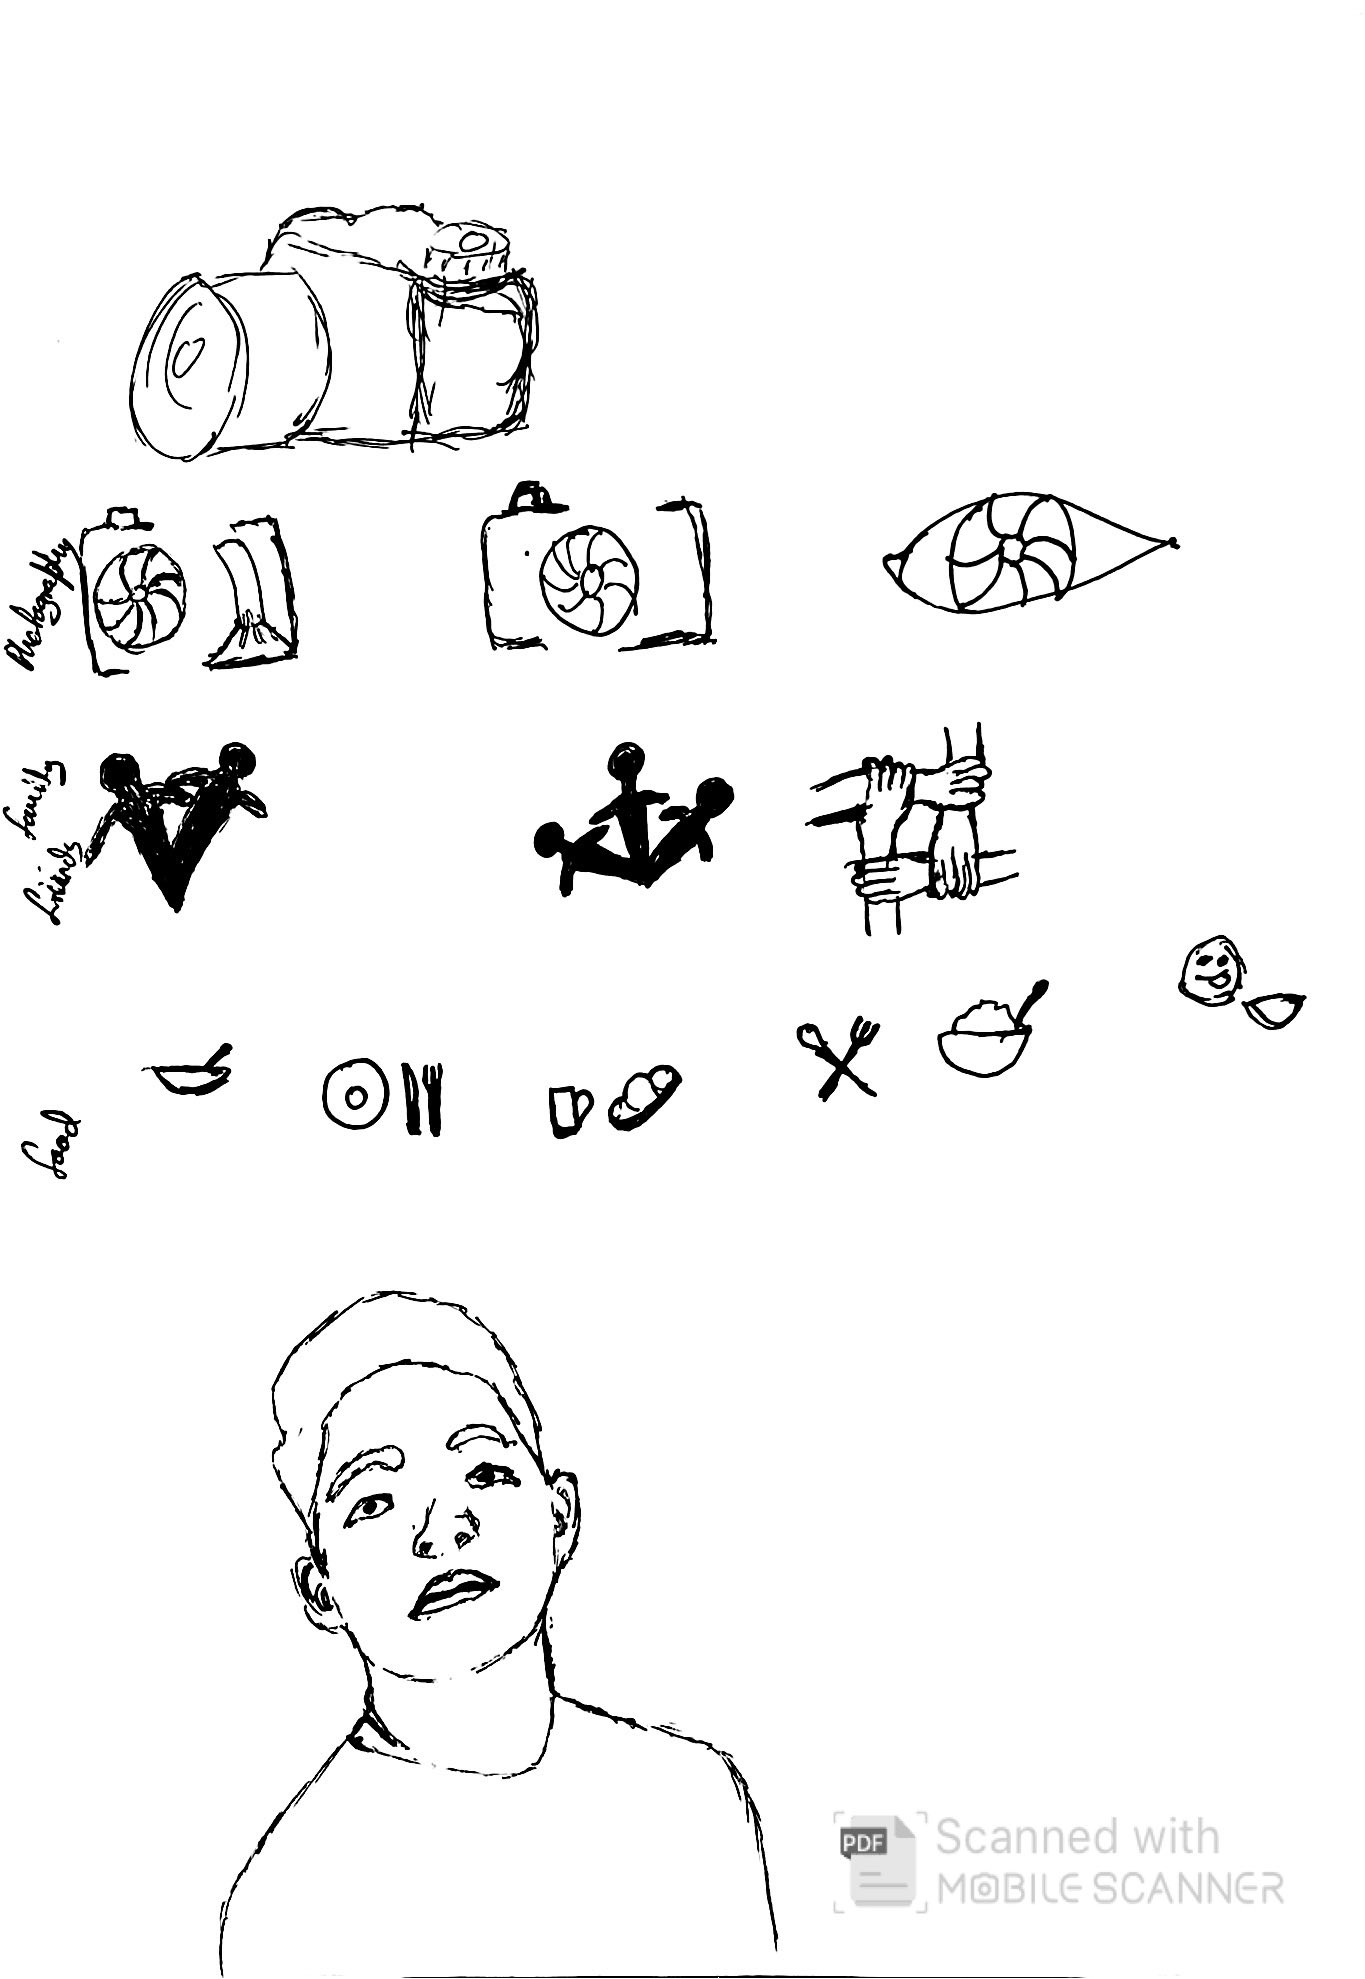
Sketches
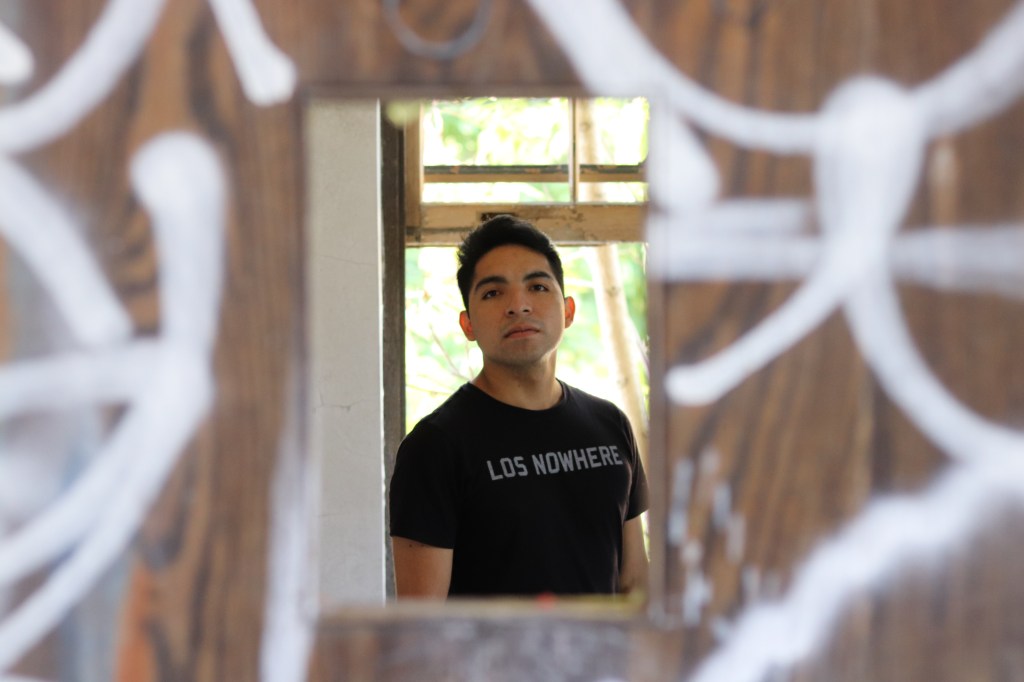
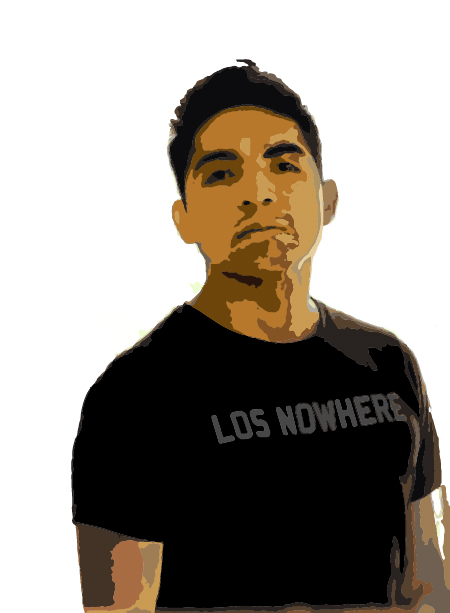
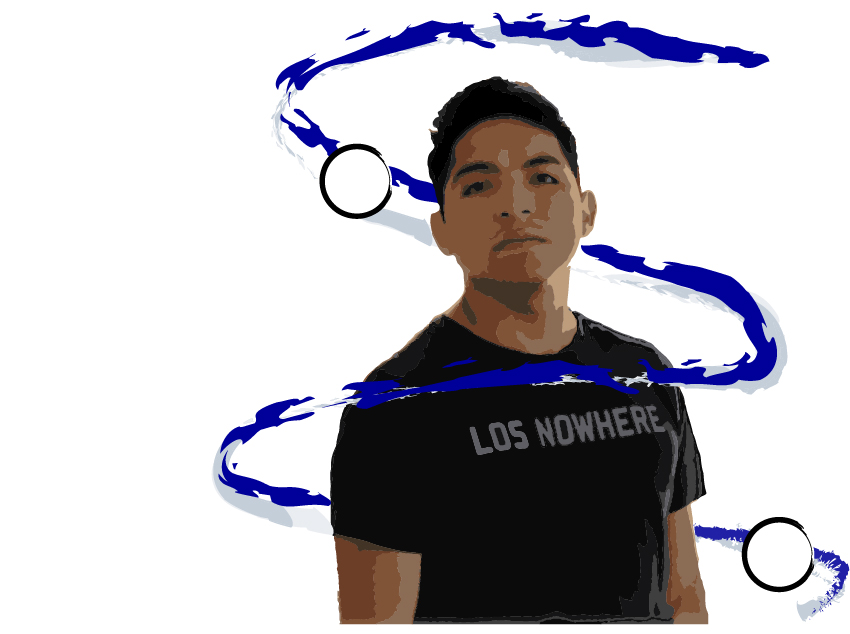
After choosing the portrait that I was going to use, I edited it to have only the part that was needed to use. After that using Photoshop I transformed the photo to vector shapes and changed the color of the shapes to give it a more natural color. Also I edited / deleted some details of it like shadows and some other detail in the hair.
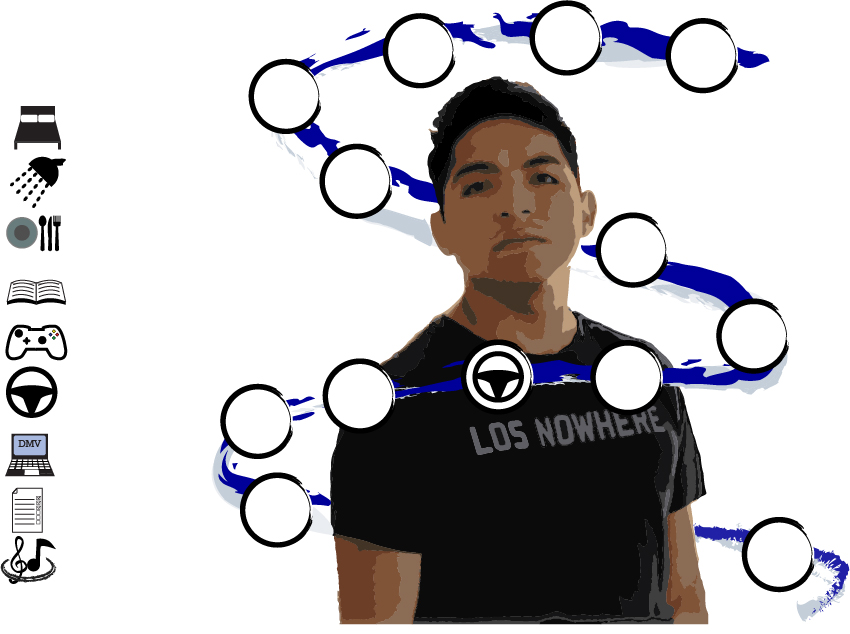
To create the poster, I also created icons that represent each of the activities that it would show in it. I did the icons and the rest of the poster using Illustrator. All the icons were created one by one using lines, shapes and colors. I made a type of wave that surrounded my portrait to give fluidity to the activities of the week. I placed each of the icons on the wave within circles, but after some revisions, I decided to change the size of the circles for each of the activities and thus use size as a sign of importance, the bigger the circle, the more important the activity.
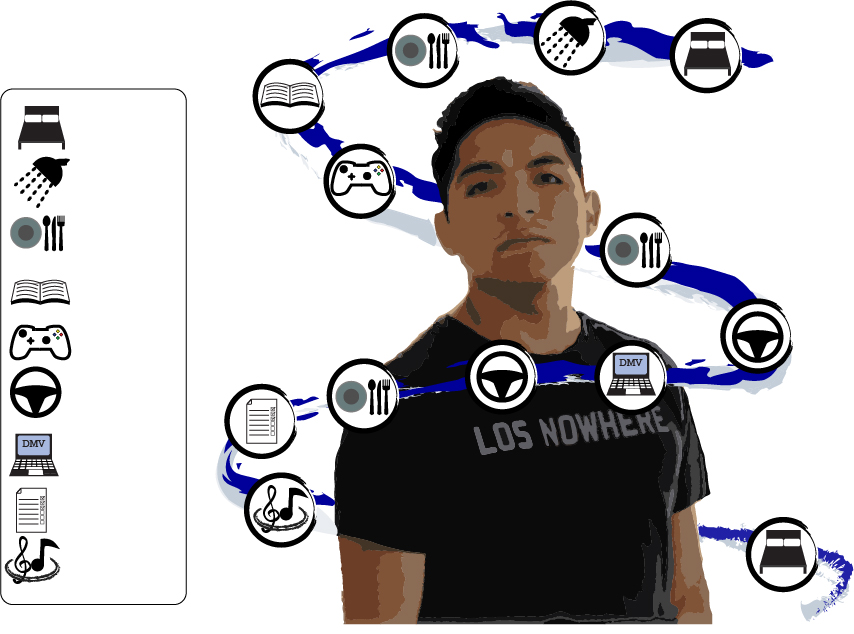
A box with the meaning of each icon was added next to the avatar. this way it would be much easier to understand the poster. I think that of the whole process of creating this poster, the most difficult thing was to choose the background color, so that the icons, the avatar and the wave are easy to see and the background helps and does not call much attention to it, but it doesn’t look too simple either.
At the end I think it came out pretty good, but still I do not feel like it is completed, I feel like I have some stuff to work on and add to it.
Final Version